Overview of e.cenaris cloud monitoring features
The features available in the e.cenaris cloud monitoring solution enable interactive real time visualization of data, reporting and enable to export data, results and graphic representations in different formats

A dedicated Infrastructure & Data Management System
- Incoming geophysical and geotechnical data flow from monitoring systems on the field, in different format
- Real-time data integration into a centralized, secured database server
- Access to interactive, custom dashboard
- Centralize metadata (reports, photos etc.) in an easy-to-organize workspace

Transform & Check your data
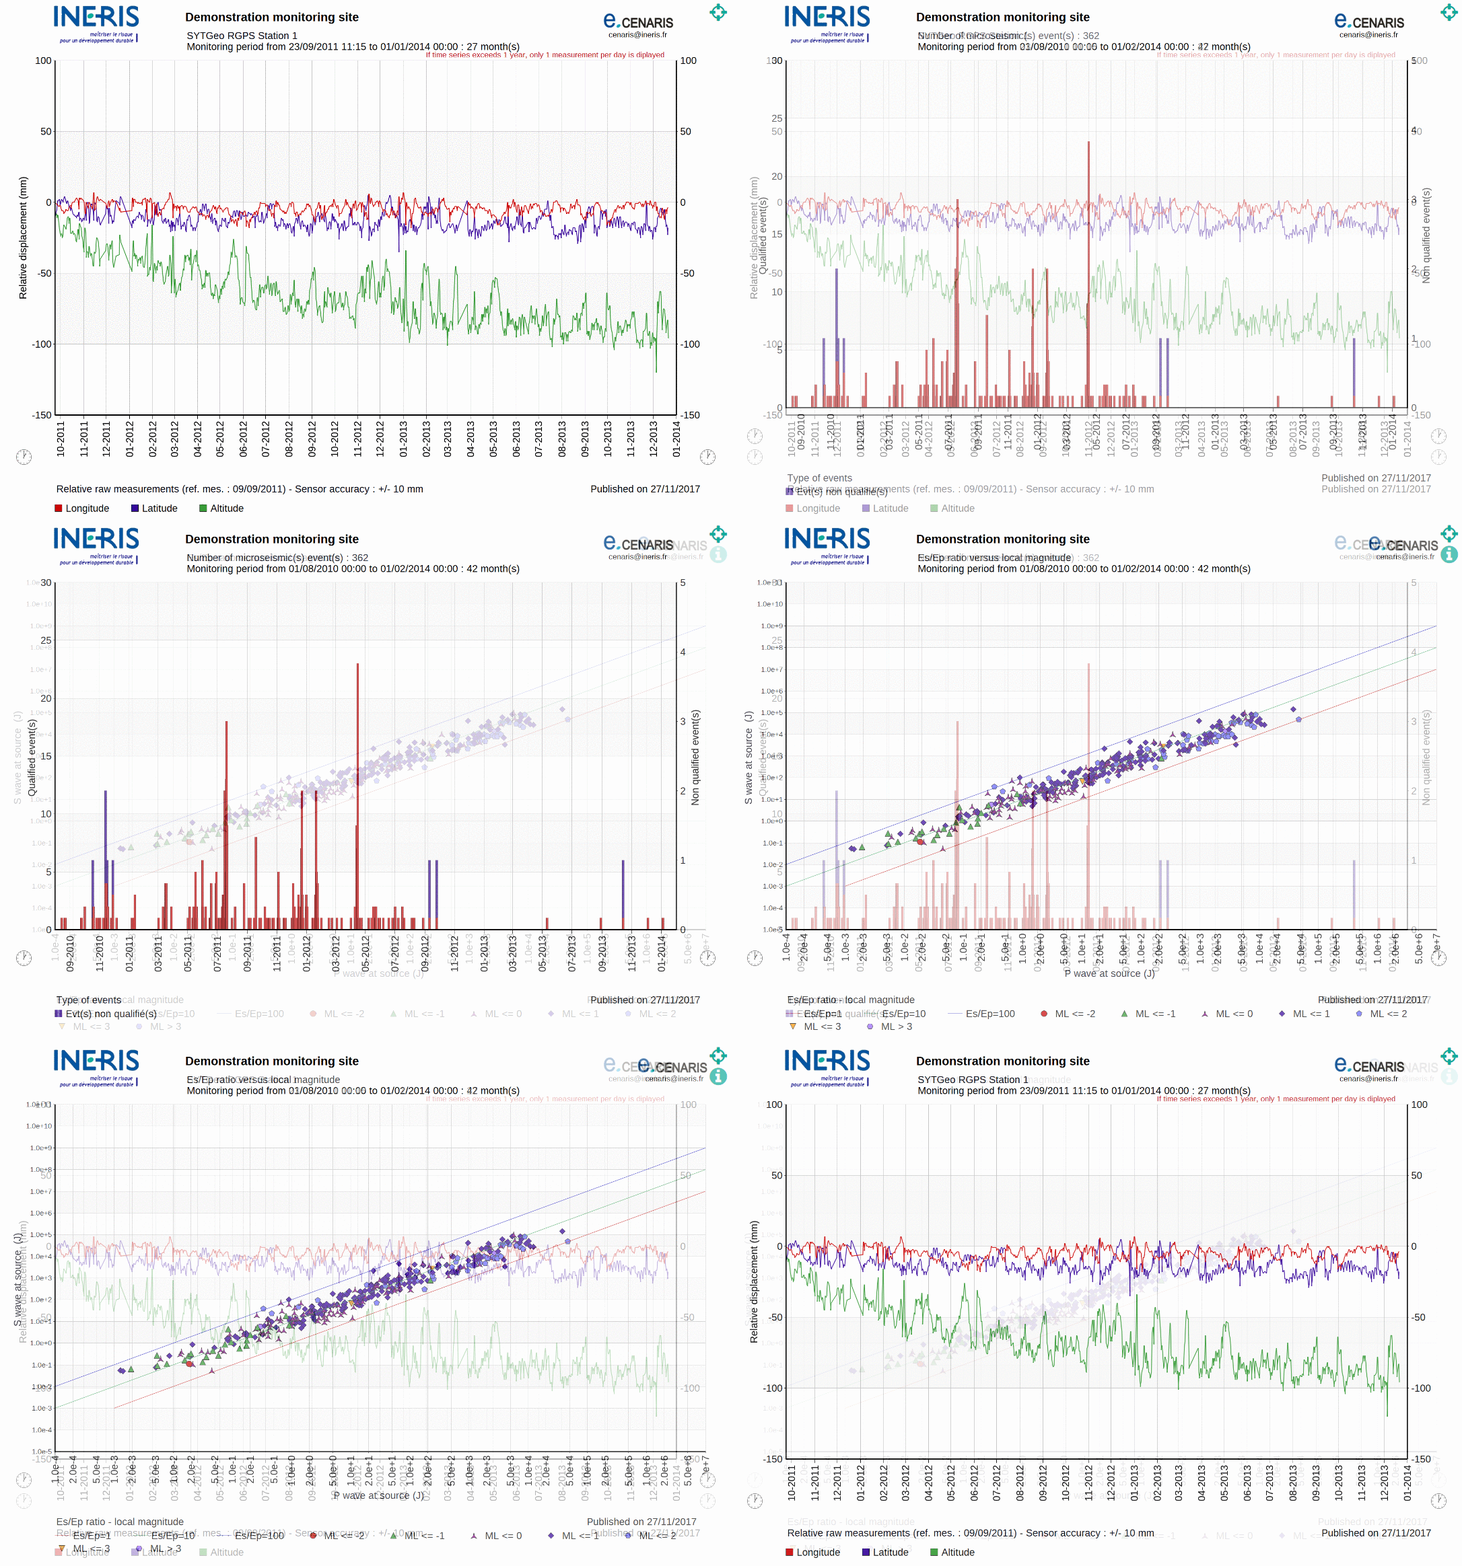
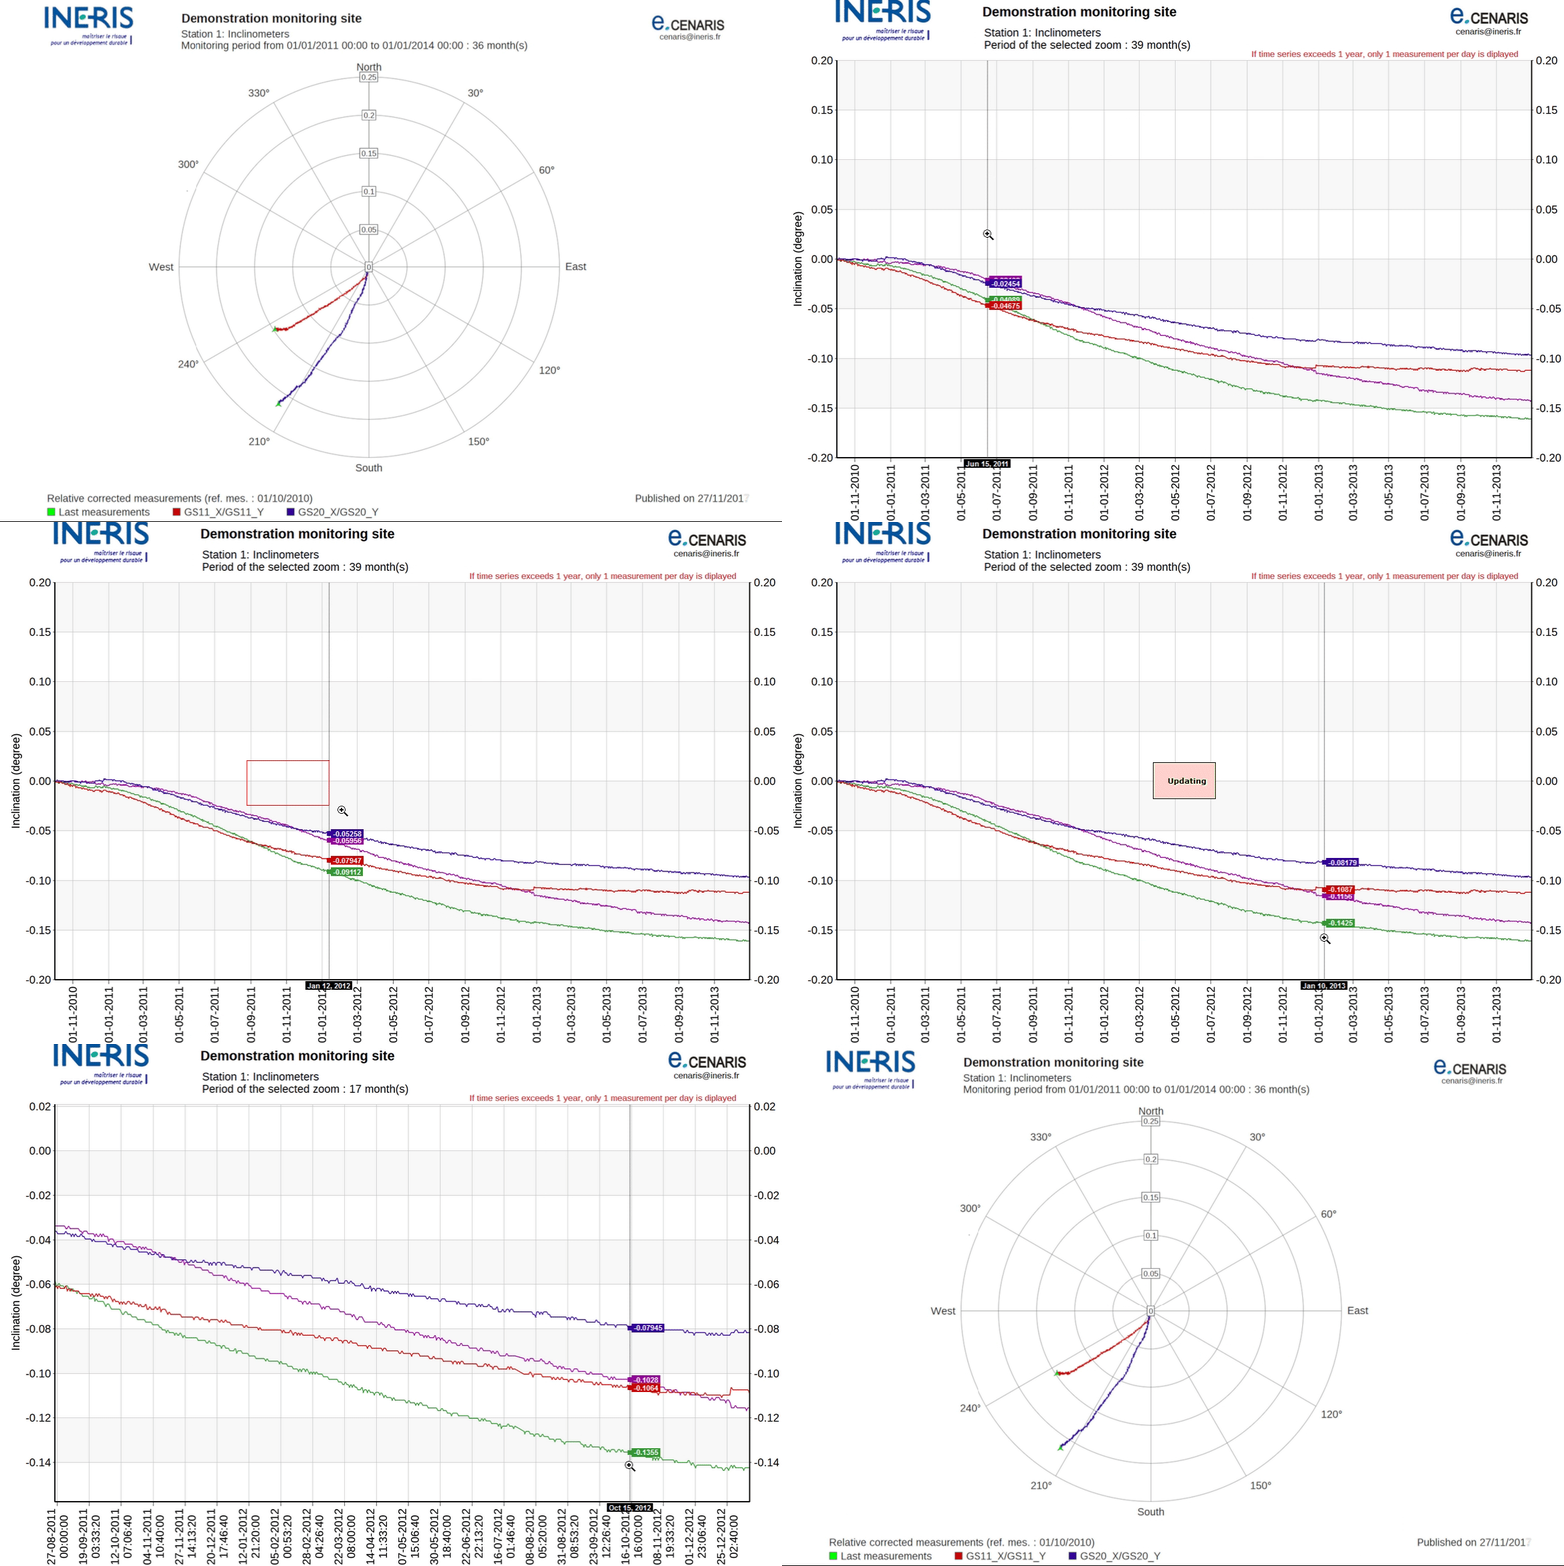
- Take advantage of numerous graphic capabilities to display time series, processed data and results through any combination of dynamic 2D/3D multi-axis plots, charts, along with statistics analysis
- Visualize your microseismic events in terms of processing, location and related source parameters

Explore your data
- Test several interactive display options to select and zoom in/out any graph or XY windows
- Edit and export raw and transformed data to easily build your own edition tasks

Map your data
- Have an overview of the locations of the seismic and microseismic events, if available
- Display interactive data-tip values (coordinates, physical parameters)
- Show additional information (measurement stations, boundaries of risk zones, etc.)

Visualize & Interpret high-resolution data in 3D
- Display and explore LiDAR laser scans, mine plans, landscapes, cliffs, caves datasets
- Examine your data in 3D and other datasets (e.g. geological data) to make interpretations

Receive Alert emails
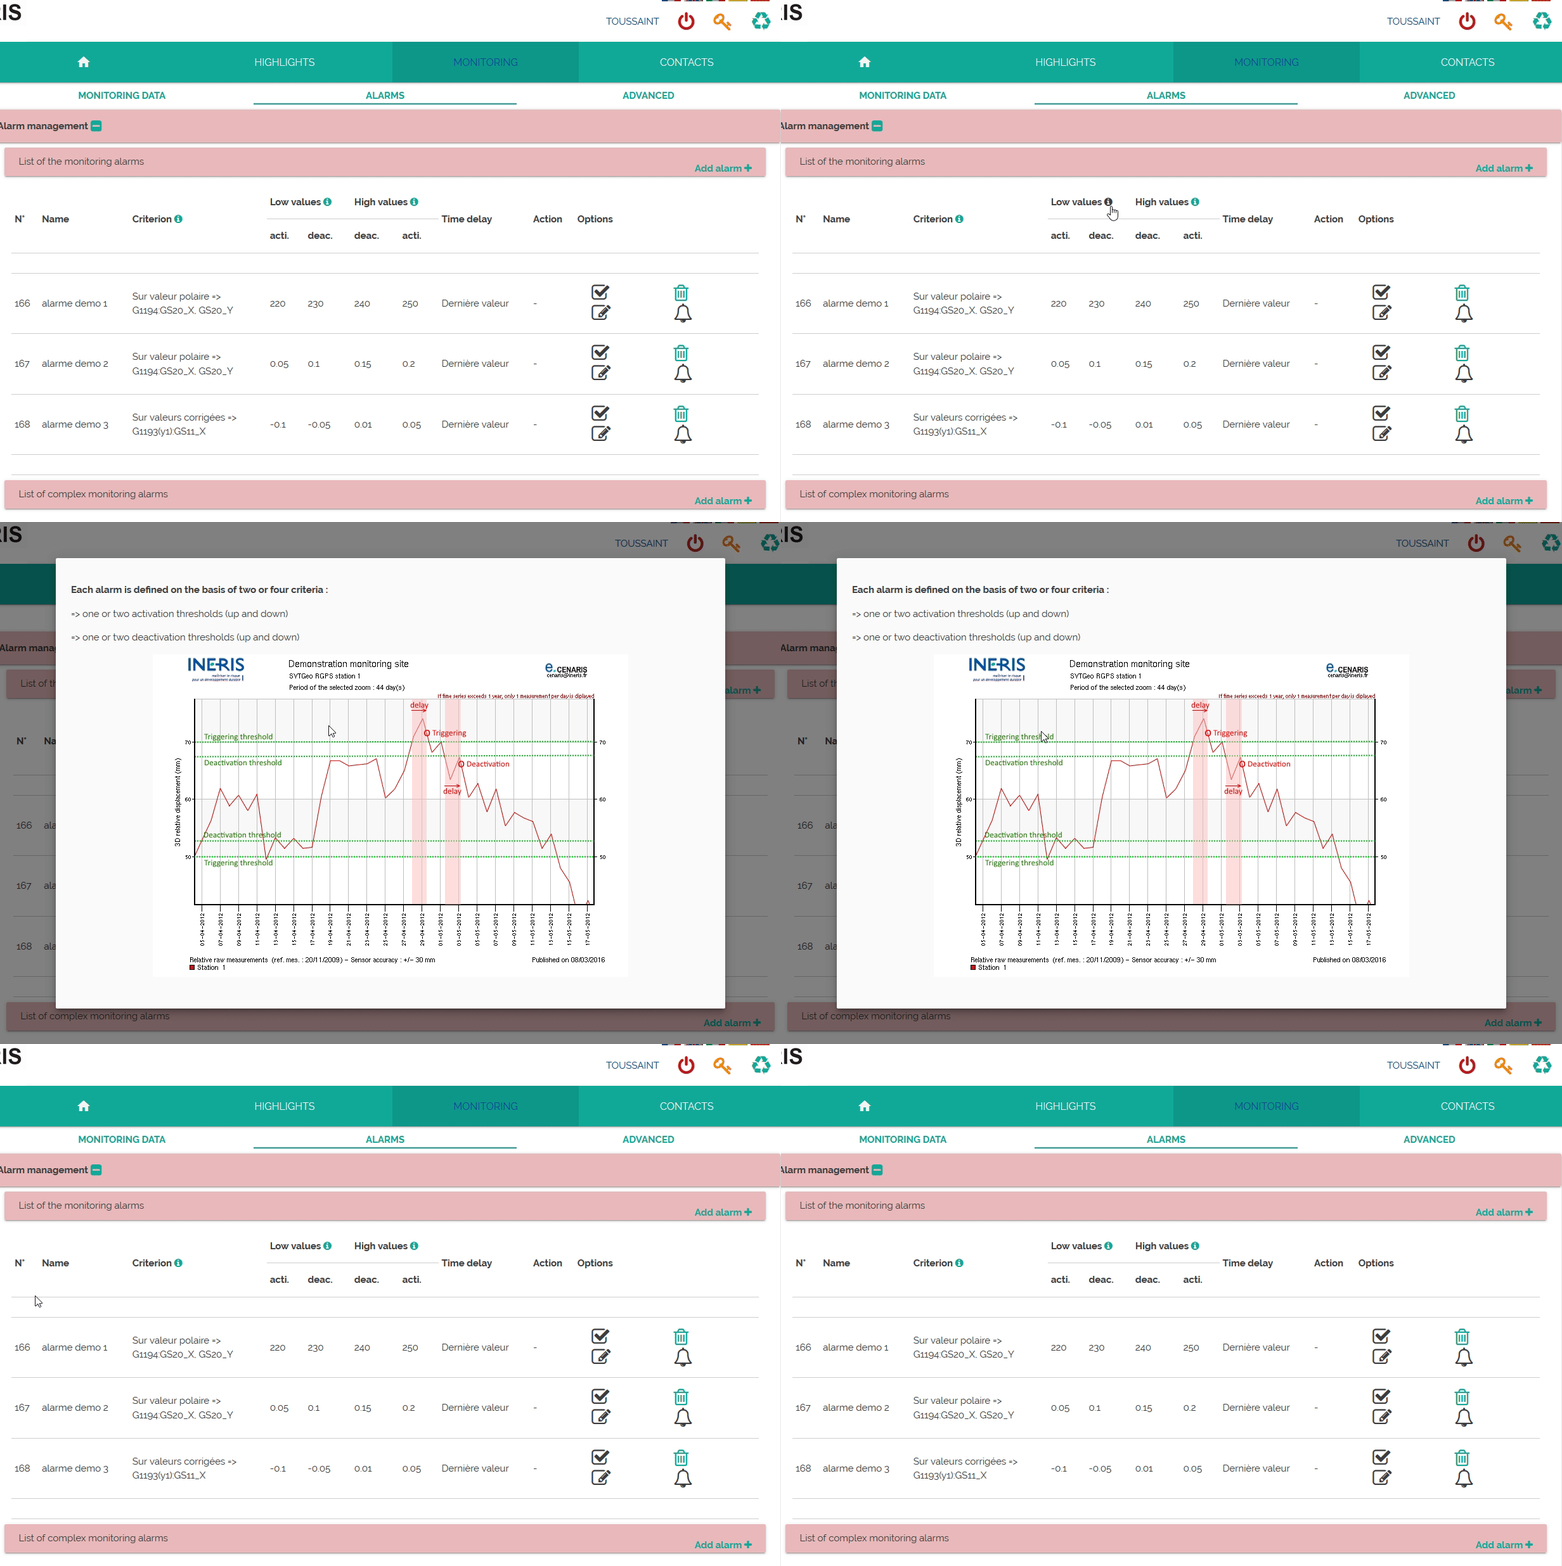
- Parameterize customized notification by email the working status of the in-field monitoring systems (change of acquisition settings, absence of data, maintenance intervention, etc.)
- Define advanced Alert emails related to data evolution, combining simple and complex variables thanks to logical operators (OR, AND)